SNAPSHOT: Trump’s Energy Crisis Spikes Utility Bills by 16%
Last Updated: 6/2026
- BY THE NUMBERS: TRUMP’S ENERGY CRISIS.
- TRUMP’S ENERGY CRISIS IS DRIVING JOB LOSSES ACROSS THE U.S.
- TRUMP’S ENERGY CRISIS IS HURTING CONGRESSIONAL DISTRICTS REPRESENTED BY REPUBLICANS.
- TRUMP’S ENERGY CRISIS IS RESPONSIBLE FOR JOB LOSSES ACROSS THE ENERGY SECTOR.
- TRUMP’S ENERGY CRISIS IS REDUCING ENERGY SUPPLY.
- HEADLINES: TRUMP ACCELERATED THE ENERGY CRISIS.
- GAS PRICES ARE SOARING BECAUSE OF TRUMP’S MILITARY ACTIONS IN IRAN
- TRUMP’S ENERGY CRISIS IS SENDING ENERGY BILLS SOARING.
- METHODOLOGY
Since Trump took office, household electric bills have risen 16% nationally, while residential natural gas prices have increased by 19%between March 2024 and March 2026. Trump’s war of choice in Iran is sending oil, diesel, and jet fuel prices skyrocketing – yet his priority is spending $2 billion in taxpayer dollars to stop homegrown clean energy production that would protect Americans from global oil shocks.
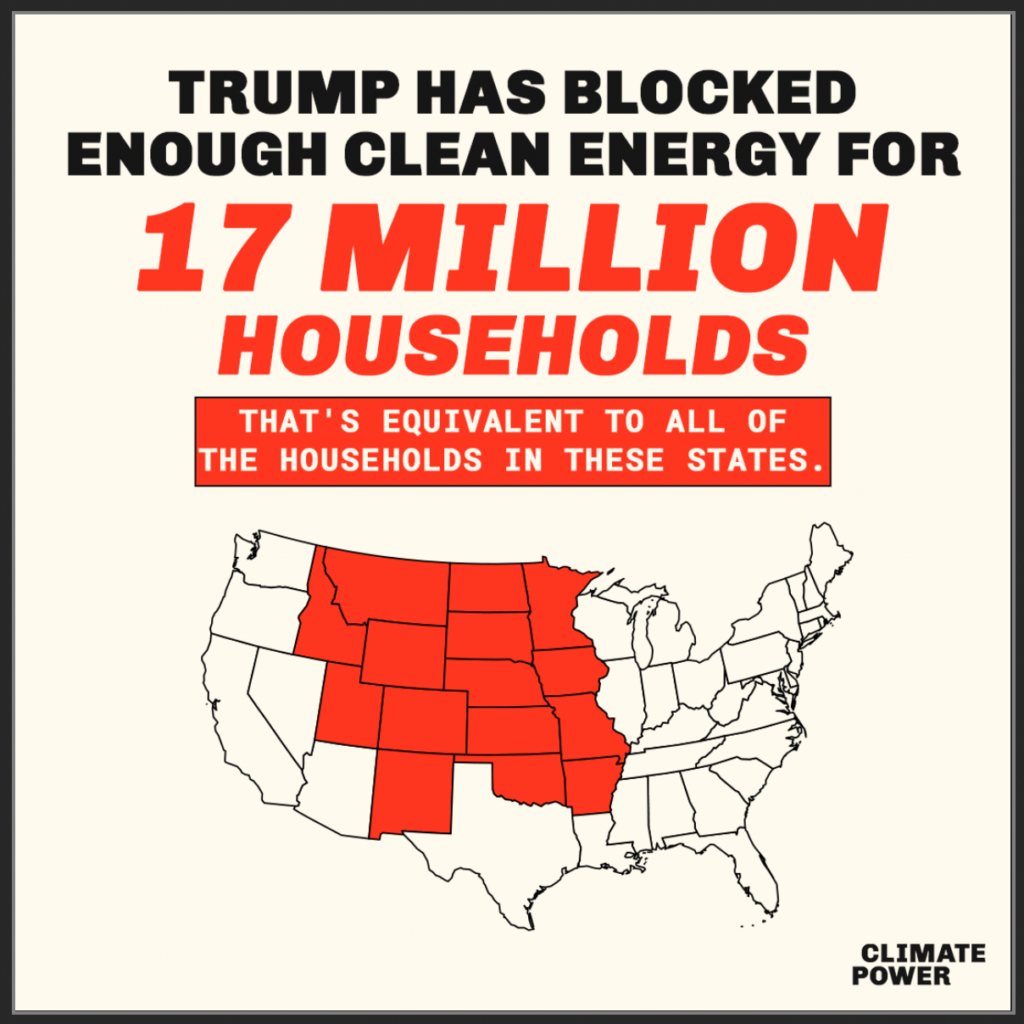
Donald Trump and Congressional Republicans started this energy crisis with their attacks on clean energy projects, and are now accelerating it with their war of choice in Iran. These canceled projects would have produced enough electricity to power the equivalent of 17 million homes. Without them, utility costs have gone through the roof, factories are closing down, and we are more dependent on volatile foreign oil. These actions are also dramatically increasing the pollution of our air and water.
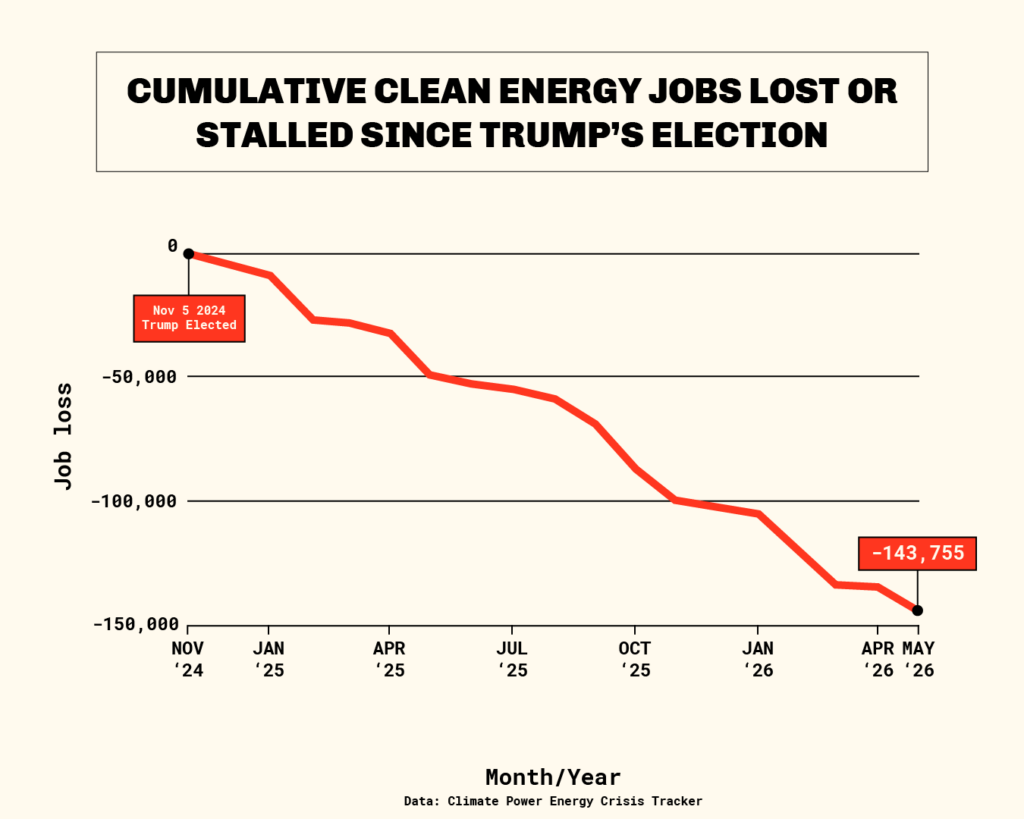
Nearly 144,000 jobs have already been lost or stalled in the clean energy sector since Trump’s election. With rising energy demand driven by data centers and extreme heat, gutting clean energy is taking critical production offline and raising costs for Americans.
Since Trump took office, gas and electric utilities have raised or sought to increase bills by more than $95 billion, affecting more than 111.9 million electric utility customers and more than 56 million natural gas customers across 49 states and the District of Columbia.
BY THE NUMBERS: TRUMP’S ENERGY CRISIS.
- Trump’s Energy Crisis is here. Companies are canceling energy projects and laying off staff due to this administration’s policies, leading utilities to hike rates as energy demand from data centers continues to rise.
- 143,755 clean energy jobs have been lost or stalled between Trump’s election in November 2024 and June 1, 2026.
| TRUMP’S ENERGY CRISIS IS DRIVING JOB LOSSES AND UTILITY RATE HIKES | |
| JOBS LOST OR DELAYED | 143,775 JOBS LOST OR DELAYED |
| LOST OR DELAYED INVESTMENT | $69.26 BILLION |
| PROJECTS CANCELED, DELAYED, OR LAYING OFF STAFF | 382 PROJECTS |
| LOST ELECTRONS | 34,201 MEGAWATTS |
| HOMES POWERED BY LOST ELECTRONS | 17 MILLION HOMES POWERED BY LOST ELECTRONS |
TRUMP’S ENERGY CRISIS IS DRIVING JOB LOSSES ACROSS THE U.S.
- 143,775 clean energy jobs have been lost or delayed between Trump’s election and June 1, 2026. Companies have canceled, delayed, lost grant funding, or laid off staff at 382 energy projects in 49 states, representing over $69 billion in lost investment.
| 10 STATES WITH THE MOST CLEAN ENERGY JOBS LOST | |||
| STATE | # OF PROJECTS | JOBS LOST OR DELAYED | INVESTMENTS LOST OR DELAYED |
| CALIFORNIA | 37 | 2,103 | $3,320,600,000 |
| NEW YORK | 28 | 9,196 | $3,900,122,000 |
| TEXAS | 26 | 4,832 | $5,526,300,000 |
| MICHIGAN | 24 | 7,916 | $1,193,900,600 |
| MASSACHUSETTS | 19 | 17,014 | $8,608,600,000 |
| COLORADO | 14 | 671 | $281,070,000 |
| OHIO | 13 | 7,165 | $1,282,900,000 |
| NORTH CAROLINA | 12 | 10,135 | $2,440,500,000 |
| WASHINGTON | 10 | 466 | $49,600,000 |
| PENNSYLVANIA | 10 | 1,114 | $194,500,000 |
| JOB LOSSES BY PROJECT STATUS | |||
| PROJECT STATUS | # OF PROJECTS | JOBS LOST OR DELAYED | INVESTMENTS LOST OR DELAYED |
| CANCELED | 97 | 80,731 | $44,830,800,000 |
| DELAYED | 32 | 36,050 | $15,827,422,000 |
| GRANT CANCELED | 163 | 11,370 | $7,858,786,600 |
| LAYOFFS | 90 | 15,604 | $747,000,000 |
TRUMP’S ENERGY CRISIS IS HURTING CONGRESSIONAL DISTRICTS REPRESENTED BY REPUBLICANS.
- 53.6% of canceled projects, 56.3% of delayed projects, and 28.9% of layoffs are in congressional districts represented by Republicans.
| CANCELED PROJECTS BY REPRESENTATIVE PARTY IN THE U.S. HOUSE | |||||
| REPRESENTATIVE PARTY | # OF PROJECTS | JOBS LOST OR DELAYED | INVESTMENTS LOST OR DELAYED | GENERATION LOSSES OR DELAYS (MW) | TOTAL HOMES POWERED BY LOST GENERATION |
| REPUBLICAN | 52 | 33,091 | $20,054,400,000 | 14,513 | 7,662,605 |
| NOT CD SPECIFIC | 19 | 11,906 | $9,821,000,000 | 13,354 | 5,730,266 |
| DEMOCRAT | 26 | 35,734 | $14,955,400,000 | 6,334 | 3,680,000 |
| PROJECT STATUS BREAKDOWN BY PARTY | ||||
| STATUS | PARTY | IMPACTED PROJECTS | JOB LOSSES OR DELAYS | INVESTMENT LOSSES OR DELAYS |
| CANCELED | DEMOCRAT | 26 | 35,734 | $14,955,400,000 |
| NO CD | 19 | 11,906 | $9,821,000,000 | |
| REPUBLICAN | 52 | 33,091 | $20,054,400,000 | |
| DELAYED | DEMOCRAT | 9 | 7,565 | $1,264,522,000 |
| NO CD | 5 | 7,170 | $2,404,000,000 | |
| REPUBLICAN | 18 | 21,315 | $12,158,900,000 | |
| GRANT CANCELLATION | DEMOCRAT | 73 | 2,428 | $2,623,670,000 |
| NO CD | 33 | 4,091 | $1,940,916,000 | |
| REPUBLICAN | 57 | 4,851 | $3,294,200,600 | |
| LAYOFFS | DEMOCRAT | 43 | 4,781 | $147,000,000 |
| NO CD | 21 | 4,143 | – | |
| REPUBLICAN | 26 | 6,680 | $600,000,000 | |
TRUMP’S ENERGY CRISIS IS RESPONSIBLE FOR JOB LOSSES ACROSS THE ENERGY SECTOR.
- All clean energy sectors have experienced job losses since Trump’s election.
- The wind, solar, electric vehicle and battery industries have lost the most jobs.
- The clean technology, electric vehicle, and solar sectors have seen the highest number of project cancellations.
| CANCELED OR DELAYED PROJECTS BY SECTOR | |||
| SECTOR | # OF PROJECTS | JOBS LOST OR DELAYED | INVESTMENTS LOST OR DELAYED |
| BATTERY | 53 | 27,203 | $17,059,400,000 |
| CARBON CAPTURE | 30 | 346 | $1,382,330,000 |
| CLEAN TECHNOLOGY | 77 | 12,023 | $9,935,456,000 |
| ELECTRIC VEHICLES | 59 | 27,219 | $7,987,222,600 |
| GRID AND TRANSMISSION | 18 | 2,209 | $1,922,100,000 |
| HYDROGEN | 53 | 10,080 | $9,116,600,000 |
| SOLAR | 61 | 31,615 | $7,658,700,000 |
| WIND | 31 | 33,060 | $14,202,200,000 |
TRUMP’S ENERGY CRISIS IS REDUCING ENERGY SUPPLY.
- 34,201 megawatts of planned energy generation have been lost due to energy projects that were canceled or delayed since Trump’s election.
- Over 17 million homes in the U.S. could be powered by the energy generation projects that have been canceled or delayed since Trump’s election.
| CANCELED OR DELAYED GENERATION PROJECTS | ||
| SECTOR | LOST GENERATION (MEGAWATTS) | HOMES POWERED BY LOST GENERATION CAPACITY |
| BATTERY | 977.50 | 576,845.00 |
| CLEAN TECHNOLOGY | 150.00 | 121,000.00 |
| SOLAR | 1,895.50 | 342,373.00 |
| WIND | 31,178.00 | 16,032,653.00 |
HEADLINES: TRUMP ACCELERATED THE ENERGY CRISIS.
- POLITICO: It was supposed to be a lifeline for a blue-collar town. Then Trump returned.
- FINANCIAL TIMES: ‘Nervous energy’: US wind and solar projects at risk as tax credits expire
- CNN: Memorial Day sticker shock: Gas prices near all-time highs
- NEW YORK TIMES: Trump’s Push to Keep Coal Plants Open Is Costing Hundreds of Millions
- REUTERS: GM-LG battery company delays return of laid-off workers to Ohio plant
- NEW YORK TIMES: Blue States Sue Trump Administration Over Offshore Wind Deal
GAS PRICES ARE SOARING BECAUSE OF TRUMP’S MILITARY ACTIONS IN IRAN
| TRUMP’S MILITARY ACTION IN IRAN IS RAISING GAS PRICES | |
| NATIONAL AVERAGE GAS PRICE (6/2) | $4.24 |
| CHANGE IN NATIONAL AVERAGE GAS PRICE SINCE 2/28 | $1.27 |
| PERCENT CHANGE IN NATIONAL AVERAGE GAS PRICE SINCE 2/28 | 43% |
TRUMP’S ENERGY CRISIS IS SENDING ENERGY BILLS SOARING.
Household electric bills have increased by more than 16% nationally since Trump took office. From March 2024 to March 2026, residential natural gas prices rose 19%, and the cost of natural gas for power generation rose about 42%.
Newly released data from the Center for American Progress, the Natural Resources Defense Council, and Climate Power reveal the breadth of rising utility costs nationwide. Since Trump took office, gas and electric utilities have raised or sought to increase bills by more than $95 billion, affecting more than 111.9 million electric utility customers and more than 56 million natural gas customers across 49 states and the District of Columbia.
| 15 STATES WITH HIGHEST ANNUAL UTILITY BILL INCREASES | ||
| STATE | UTILITY PROVIDER | ANNUAL COST INCREASE |
| Massachusetts | Eversource Gas Company of Massachusetts (Eversource)1 | $582.48 |
| New York | Consolidated Edison2 | $481.56 |
| Washington | Puget Sound Energy2 | $437.52 |
| Rhode Island | The Narragansett Electric Co (Rhode Island Energy)2 | $432.96 |
| Wyoming | Black Hills Power Wyoming | $391.08 |
| Pennsylvania | Wellsboro Electric | $363.36 |
| California | Imperial Irrigation District | $357.72 |
| New Jersey | Orange and Rockland Utilities | $351.12 |
| North Carolina | Duke Energy Progress2 | $343.92 |
| New Mexico | El Paso Electric3 | $335.52 |
| Wisconsin | Xcel Energy4 | $320.64 |
| Indiana | CenterPoint Energy (Southern Indiana Gas and Electric)5 | $312.00 |
| South Dakota | Black Hills Power South Dakota | $301.56 |
| Oklahoma | Public Service Company of Oklahoma | $300.00 |
| Virginia | Town of Bedford | $300.00 |
1 Cost increase compared to winter 2024-2025.
2 Total increase by 2028.
3 For a residential customer using 500 kWh per month during the winter after two phase-ins.
4 Total increase by 2027.
5 Total increase after all phase-ins.
METHODOLOGY
The Clean Energy Business Impact Tracker tracks clean energy projects or companies that the press has identified as delayed or canceled since Trump’s inauguration. This tracker will only include projects where a private company can be identified as the lead investor. The tracker will list:
- Canceled clean energy projects.
- Indefinitely delayed clean energy projects.
- Delayed projects with a delay of at least one year for restarting production.
- Temporary and permanent layoffs at facilities producing clean energy technologies.
- Temporary layoffs will be removed from the tracker if operations resume.
- Projects or facilities impacted by federal clean energy and/or emission reduction grant cancellations.
- Projects or facilities impacted by federal grant cancellations are omitted if the company announces it will continue with the planned facility.
The tracker will list the following information on clean energy projects:
- Investment loss from all included projects.
- Investment losses include private sector funding and federal grant funding for projects.
- Job loss from all included projects.
- Job totals include permanent and temporary (ex: construction) jobs.
- Indirect jobs are not included.
- Location of facility and CD information, where available.
The tracker will also include, where applicable, the lost power generation from canceled or delayed projects in megawatts, and a calculation of the number of homes the project could power. If news coverage of a project includes the estimated number of homes it could power, that number will be used. The calculation for expected homes powered by the generation facility assumes:
- The average American household consumes 10,791 kilowatt hours of electricity per year, or 1.23 kilowatt per hour.
- The calculation uses stated project capacity.
- For wind projects, the calculation assumes 8,760 hours of operations per year (continual operations).
- For solar projects, the calculation assumes 4.5 hours of generation per day, or 1642.5 hours of generation per year.
- For battery projects, the calculation assumes the average American household consumes 1.23 kilowatts of energy per hour.
This tracker is updated on a weekly basis and is current through June 1, 2026.